
Plotting of graph in physics practical class is not something strange to students performing experiments in physics laboratory. However, some students do encounter some problems when trying to plot graph or to choose appropriate scale for a graph.
I will try to put you through the following
- How to plot graph in physics practical
- How to plot graph in physics practical
- How to choose an appropriate scale for a graph
Before I start the explanation, it is important to note that you do your physics practical making sure you avoided all possible errors for your readings to be accurate. If errors are not avoided, it may make the graph a little bit difficult for you to plot.
Now, going to the subject matter “How to plot graph”
Read: Guide on WAEC physics practical questions and answers
How to Plot Graph And Choose Scale in Physics Practical
- The first thing you need to get is a graph sheet. I will recommend that you buy a standard graph sheet.
- The vertical axis is the Y-axis while the horizontal axis is the x-axis
- Count the number of y- axis boxes and x-axis boxes of your graph sheet
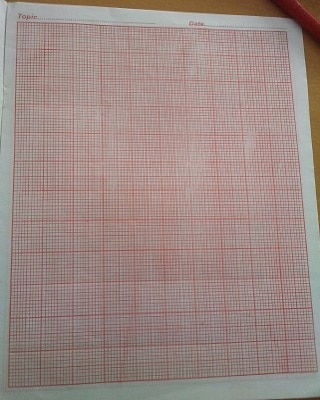
In the above graph, there are 24 Y-axis small boxes while there are 20 X-axis small boxes. This information is what you will use to choose an appropriate scale.
(4) For Y-axis, divide the number of boxes by the highest value y in your table. For X-axis, divide the number of boxes with the highest value of x in your table. For instance, if the highest value for y is 12, it means 24boxes/12 = 2 boxes. This means 2boxes i.e 2cm on your graph will represent I unit for y-axis. You can repeat the same for x-axis.
Note: Your plot must be 2/3 of your graph.
For better understanding, I will give you a table of value which i will choose an appropriate scale for and then plot.
Example how plotting Graph in Physics
Plot the graph of Y= 4, 6, 8, 10, 12 against X= 1, 2, 3, 4, 5
The graph I plotted is shown below
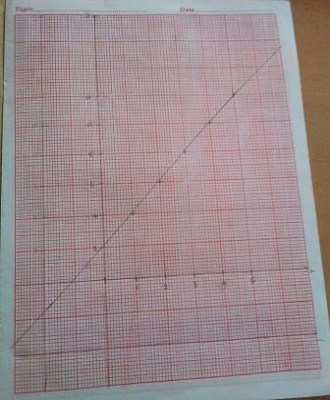
In this graph, i decided to leave six boxes (6cm) down the graph and six boxes (6cm) to the left hand side of the graph. This is not a law, it depends on how neat you want your graph to be.
This means I have 18 boxes left for y-axis and 14 boxes left for x-axis. The scale I used was 2cm on the graph represents 2 unit on the y-axis and 2cm on the graph represent 1 unit on the x-axis.
This is how i choose the scale, for y-axis (18 boxes/12 = 1.5 boxes; i rounded it up and i make it 2 boxes to represent 2 unit), for x-axis (14 boxes/5 = 2.8 boxes; i made this 2 cm to represent 1 unit)
The next thing is that Located the values on the graph and mark it with a (+) for both y and x axis. Then I joined all the points using a transparent ruler and ensure a line of best fit. The line of best fit is drawn so that the points are evenly distributed on either side of the line.
Note: Make sure you indicate each axis with the symbols you are given ( V against I) with their units. Also indicate your choosen scale at the top of the graph. This information attracts make in physics practical exams.
General note on ploting graphs in physics:
- For scales to be reasonable, graph must occupy at least 1/3 of the page
- Scales using multiples or sub-multiples of prime numbers such as 3,7,9,13 etc are not good enough
- Points should be plotted correctly to nearest half square on both axes
- To obtain the suitable line of best fit mark, at least three points must be correctly plotted
- Starting from origin is part of graph if intercept is required
- To find slope, large right-angled triangle implies that it occupies at least 1/3 of graph page.
Recommended: How to learn physics concepts